Candlestick patterns cheat sheet: How to understand any candlestick pattern without memorizing a single one
You’re probably wondering:
“Gosh!”
“There are so many candlestick patterns. How do I remember all of them?”
Well, you don’t have to.
Because if you understand the 2 things I’m about to share with you, then you read any candlestick patterns like a pro (think of it like a candlestick pattern cheat sheet).
Here’s what you must know…
- Where did the price close relative to the range?
- What’s the size of the pattern relative to the other candlestick patterns?
Let me explain…
1. Where did the price close relative to the range?
This question lets you know who’s in control momentarily.
Look at this candlestick pattern…
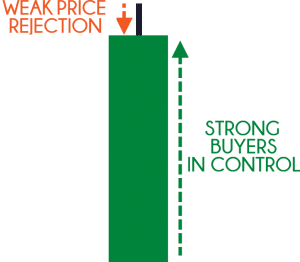
Let me ask you…
Who’s in control?
Well, the price closed the near highs of the range which tells you the buyers are in control.
Now, look at this candlestick pattern…
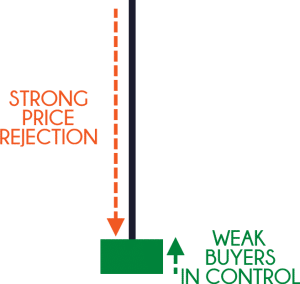
Who’s in control?
Although it’s a bullish candle the sellers are actually the ones in control.
Why?
Because the price closed near the lows of the range and it shows you rejection of higher prices.
So remember, if you want to know who’s in control, ask yourself…
Where did the price close relative to the range?
Next…
2. What’s the size of the pattern relative to the other candlestick patterns?
This question lets you know if there’s any strength (or conviction) behind the move.
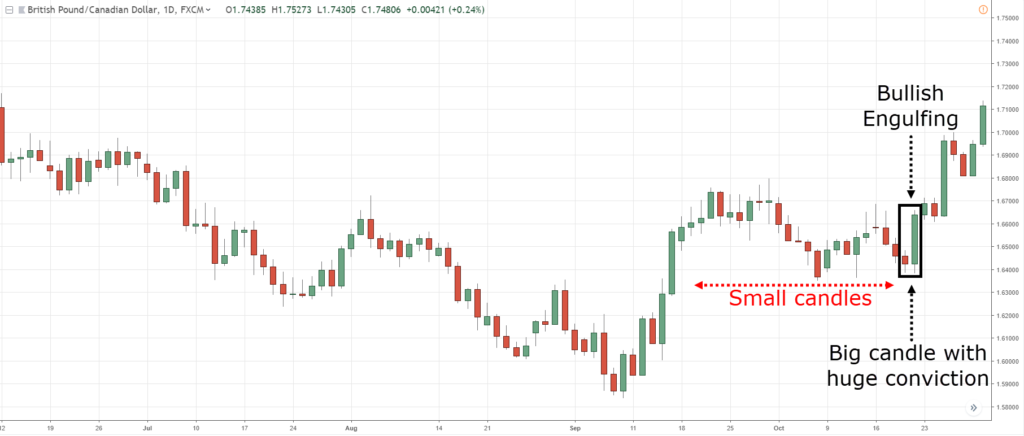
What you want to do is compare the size of the current candle to the earlier candles.
If the current candle is much larger (like 2 times or more), it tells you there’s strength behind the move.
Here’s an example…
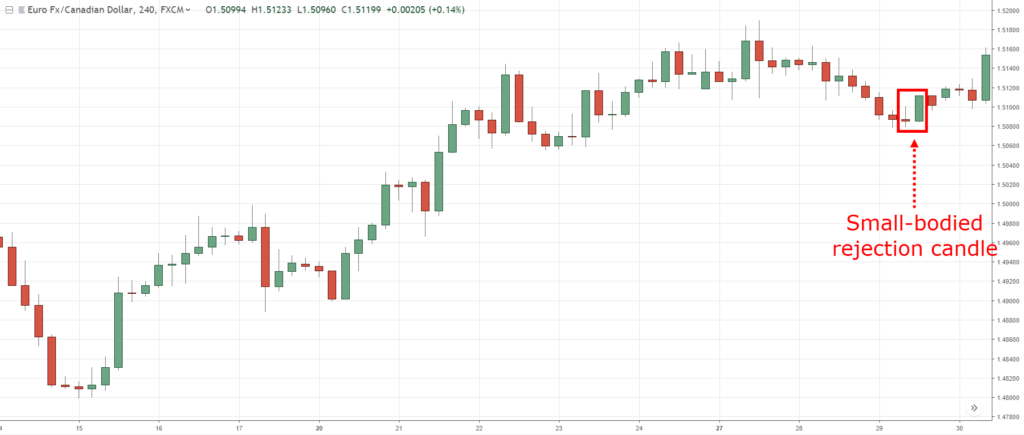
And if there’s no strength behind the move, the size of the current candle is about the same size as the earlier ones.
An example…
Does it make sense?
Great!
Now you have what it takes to read any candlestick pattern without memorizing a single one.
Bonus: How to read candlestick chart and “predict” market turning points with deadly accuracy
Here’s the thing:
The market doesn’t move in one straight line.
Instead, it goes…
Up and down, up and down, up and down, right? (Something like that)
And you can classify this “up and down” pattern into:
- Trending move
- Retracement move
This is important, so let me explain…
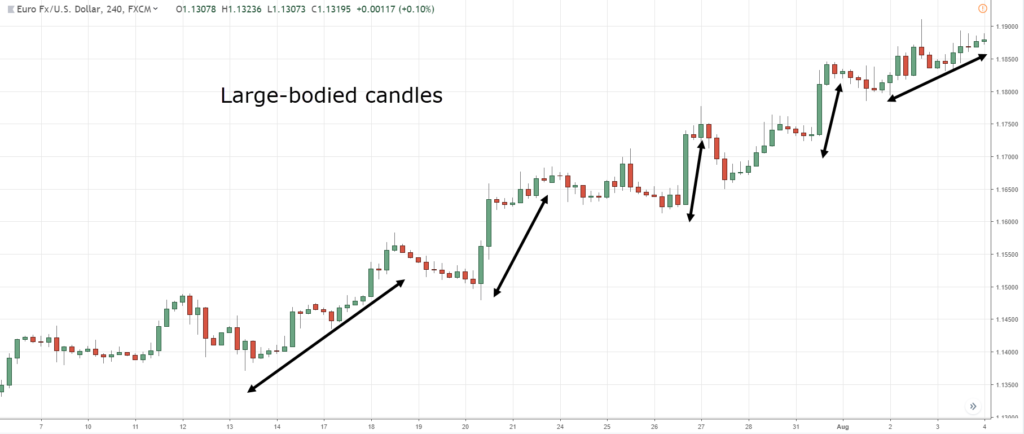
Trending move
A trending move is the “stronger” leg of the trend.
You’ll notice larger-bodied candles that move in the direction of the trend.
An example:
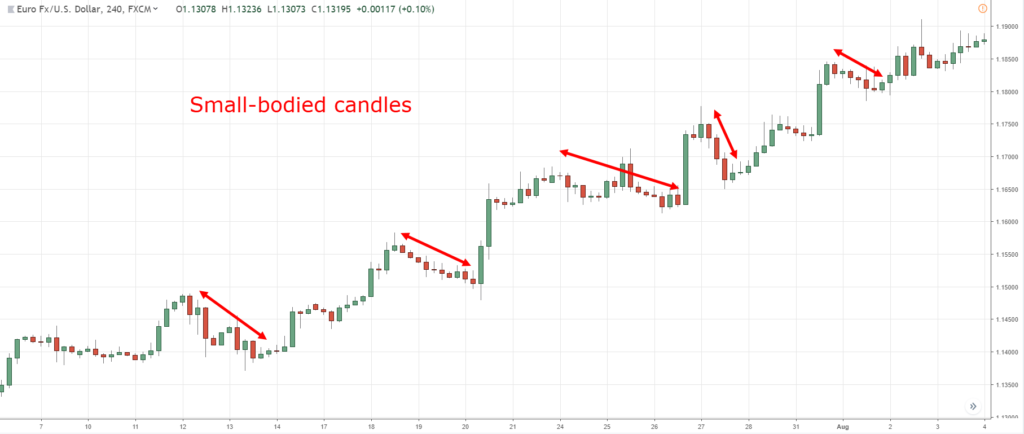
Retracement move
A retracement move is the “weaker leg of the trend.
You’ll notice small-bodied candles that move against the trend (otherwise known as counter-trend).
An example:
You might be wondering:
“Why is this important?”
Because in a healthy trend, you’ll expect to see a trending move followed by a retracement move.
But when the trend is getting weak, the retracement move no longer has small-bodied candles, but larger ones.
And when you combine this technique with market structure (like Support and Resistance, Trendline, etc.), you can pinpoint market turning points with deadly accuracy.
Let me give you an example…
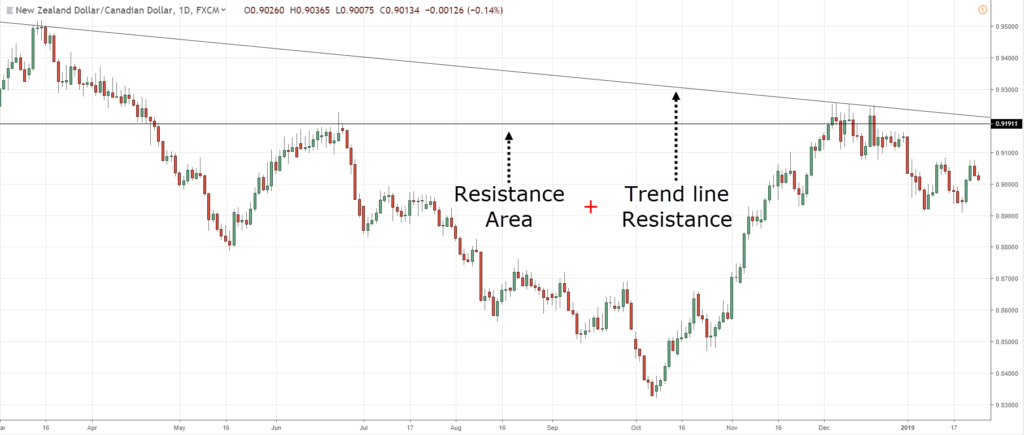
NZD/CAD Daily:
On the Daily timeframe, the price is at Resistance area and has a confluence of a downward Trendline.
The price could reverse lower so let’s look for a shorting opportunity on the lower timeframe…
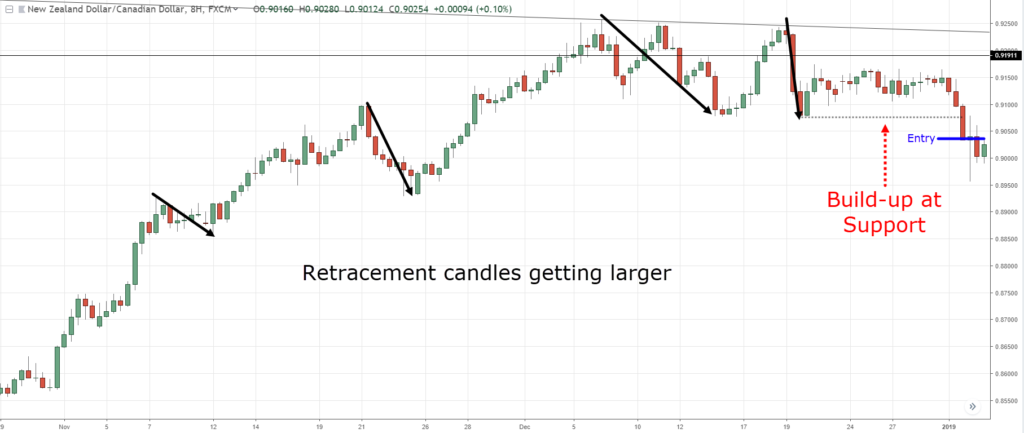
NZD/CAD 8-hour:
On the 8-hour timeframe, the selling pressure is coming in as you notice the candles of the retracement moves getting bigger (a sign of strength from the sellers).
Also, the buying pressure is getting weak as the candles of the trending move get smaller.
One possible entry technique is to go short when the price breaks and close below Support…
This is powerful stuff, right?
Frequently asked questions
#1: Is this guide applicable to all types of instruments or is it better suited to the Forex market?
The concepts in this guide can be applied to all markets with sufficient liquidity. This includes stocks, futures, bonds, etc.
#2: Are the candlestick patterns that you’ve mentioned earlier best suited for certain timeframes?
There’s no best timeframe to trade the candlestick patterns, it all boils down to your trading approach and the trading timeframe you’re on.
It doesn’t make sense to be looking at candlestick patterns on the daily timeframe if you’re a short-term trader entering your charts on the 15-minutes timeframe.
#3: Do you look at the news when you trade?
I don’t take into account news when I trade.
Because I believe all the news out there has already been expressed in the price of the market. And my trading strategy is developed ahead in time without accounting for news. If I were to follow the news instead of my trading strategy, then I’m no longer following my trading plan.
Look, if you don’t follow your trading plan and instead get affected by the news, then your actions are no longer consistent. And if you do not have a consistent set of actions, you’re not going to get a consistent set of results.
So, what’s next?
You’ve just learned that candlestick patterns give you an insight into the markets (like who’s in control, who’s losing, where did the price get rejected, and etc.).
However, you don’t want to trade candlestick patterns in isolation because they don’t offer an edge in the markets.
Instead, use them as tools to “confirm” your bias so it can help you better time your entries & exits.



Comments
Post a Comment